Critical Process Capability (Cpk)


O'PEEP'S CPK EXPLANATION 

Imagine you park your rather big car in your rather tiny garage. This occasionally results in scratching your door panels? You are sometimes closer to one wall or to the other? The more distance you keep from those nasty walls, the less likely a scratch, the better your Cpk value.
Of course, you are not able to always park exactly centered even though you are always fully awake. For this short-term variation the Cpk tells you about your performance.

LOOK INSIDE ELEARNING  


The Cpk Index compares the distance from the process center to the nearest Specification Limit and to the process spread

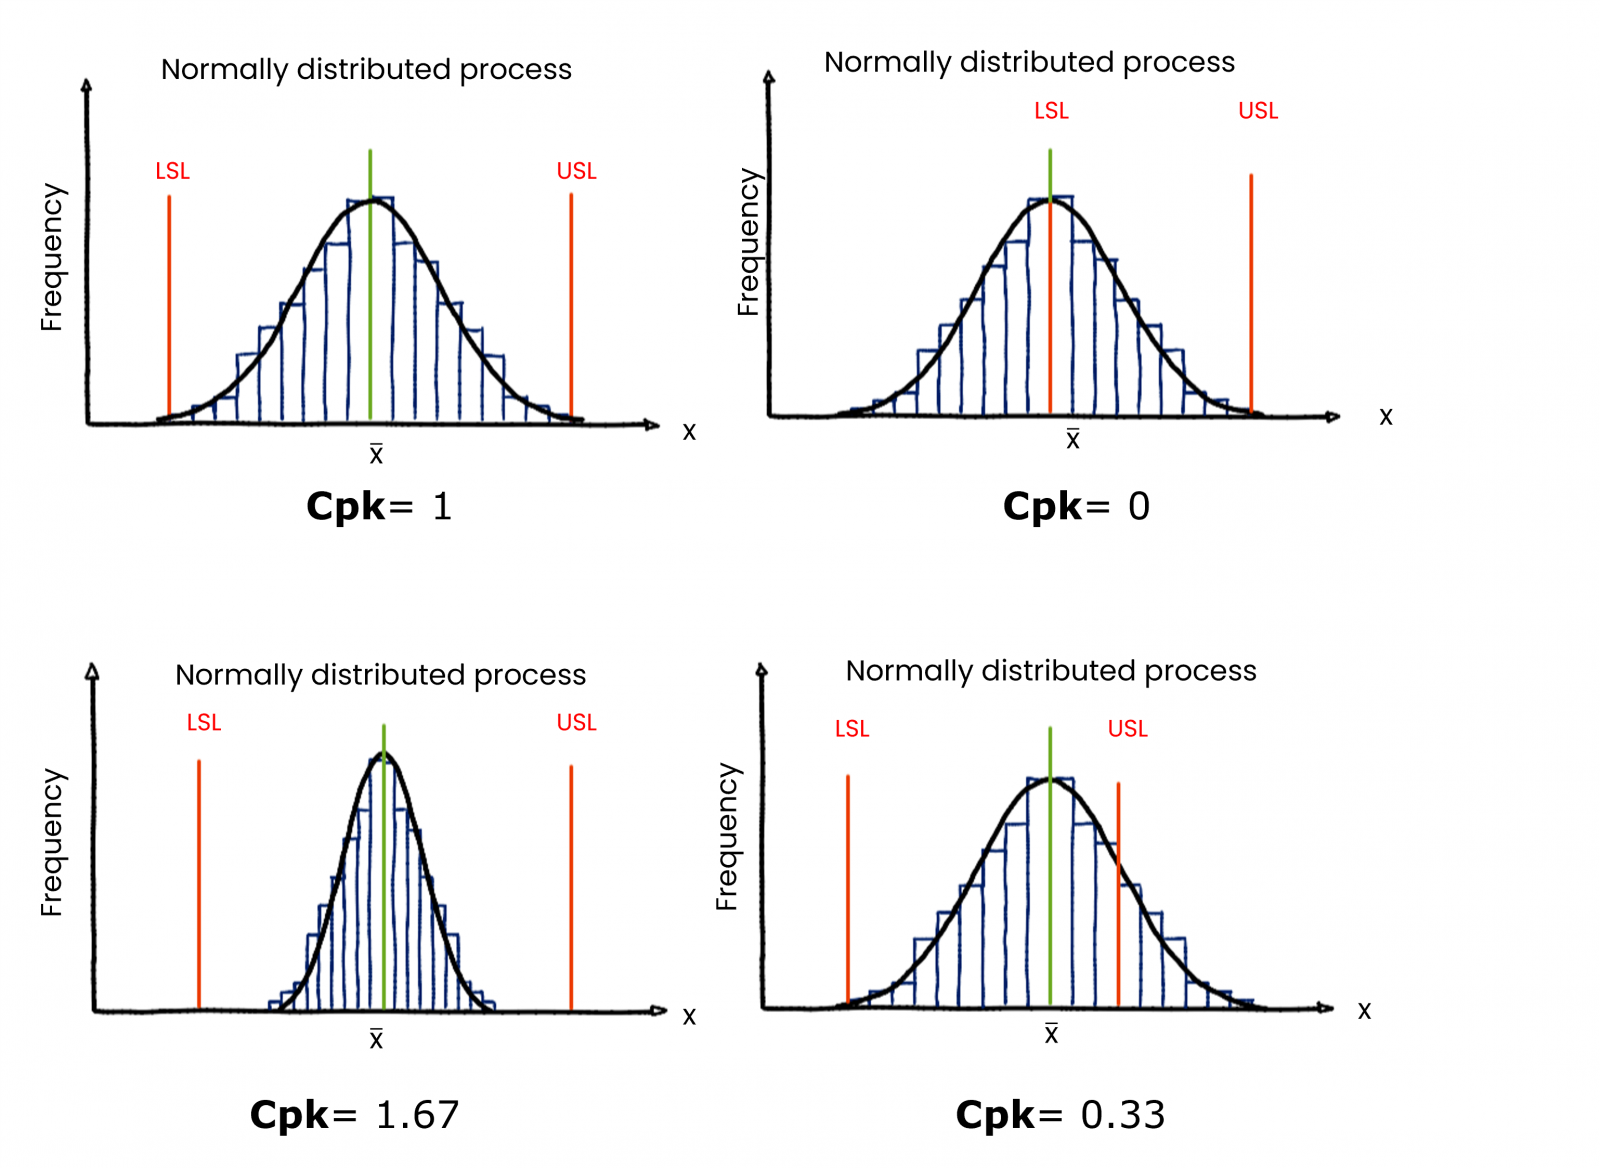
The greater the Cpk, the better the process fits between the specifications. The underlying concept is that a process which is “more on target” is more capable than a process that is wider distributed. Have a look at the two processes below. Process A is better than Process B even though through sorting you have the same number of “Out of Specification events” in both processes. 


Many organizations strive for a Cpk of 1,5. Is this a good idea? 
Enjoy our reading of 3min


          3 MIN READ           

UNDERSTANDING CPK

As you can see in the graphs, Cpk varies depending on where the center of the distribution is with respect to the specification limits but also depending on the spread (standard deviation) of the distribution:

  • The closer to the center of the specification limits, the better the Cpk. 
  • The less spread, the better your Cpk.

WHAT CPK STANDS FOR

"Cp" stands for Critical Process Capability whilst the "k" comes from Japanese and means "Katayori" which is bias.
 

This graph on normal distribution, the Gauss curve, explains what is what in process capability.  Find an example to calculate Cpk.These normal distribution graphs visualize process capability depending on the spread of distribution and specification limits, upper and lower spec limit.

CAPABILITIES DON’T GROW ON TREES

Our Courses 

CPK, PROCESS YIELD, SCRAP RATES, PPM

If a process is normally distributed, Cpk and process yield are linked. The metrics process yield and scrap rate are also measures for process capability. You typically find them expressed in percent or ppm (parts per million). 
For example, a Cpk of 1.33 means that less than 0.01% of the total production is scrap. See our table below. 

Cpk correlates with process yield which correlates with DPMO. You can convert Cpk to process yield. Use this table.

ASSUMPTIONS OF THE CPK

  • Data is representative of the process
  • The process is stable (no special causes)
  • Data is normally distributed

HOW TO CALCULATE CPK

Calculate Cpk Critical process capability. Use this formula. The equation is about Lower and Upper Specification Limit.

CPK vs PPK

Click here to learn more about the differences.


What are the core ingredients it takes to benefit from Process Capability? Enjoy our reading  

          3 MIN READ           

FOR MINITAB USERS

In practical applications, statistical software does not ask if your process data is long- or short-term. Thus e.g. Minitab is estimating short-term variation from your data by using:


​​