Cpk vs Ppk


O'PEEP'S CPK VS PPK EXPLANATION 

Imagine you have a rather big car which you park in your rather tiny garage. Does this occasionally result in scratching your door panels? Sometimes you are closer to one wall or to the other? Cpk and Ppk both tell you how capable you are to park your car centered between the garage walls. While Cpk looks at how you may impress a bystander just this afternoon, the Ppk value looks at the likelihood of a scratch in the long-term, e.g., considers the ground being icy in winter times 

look inside elearning  


Both, the Cpk and Ppk are indexes for process capability. Cpk is for short-term variation, Ppk is used for long-term variation. Both compare the distance from the process center to the nearest specification limit and to the process spread.
 

CPK/ PPK - WHAT IS THE DIFFERENCE?

Cpk is calculated considering "short-term" process variation. E.g., for a process running all year long, short-term would be a few subsequent days of production. In a production process, short-term variation is the so-called machine-variation. If all other factors were constant, this is the minimum amount of variation to be expected. 
The Cpk tells us, what performance the process is capable of, if there are only short-term sources of variation.

The Ppk is calculated considering the "long-term" process variation. The long-term variation considers more long-term sources of variation, e.g. change of raw materials, changes of suppliers, changes of temperature over the year etc... Having data from a couple of months, you can usually assume that it includes all relevant sources of variation. The long-term variation (as referenced by the Ppk) tells us, what process performance we can expect to experience overall.


WORK SYSTEMATICALLY WITH METHODS     

Our Courses 

HOW TO CALCULATE CPK and PPK

Calculate Cpk Critical process capability. Use this formula. The equation is about Lower and Upper Specification Limit.


Calculate Cpk Critical process capability. Use this formula. The equation is about Lower and Upper Specification Limit.

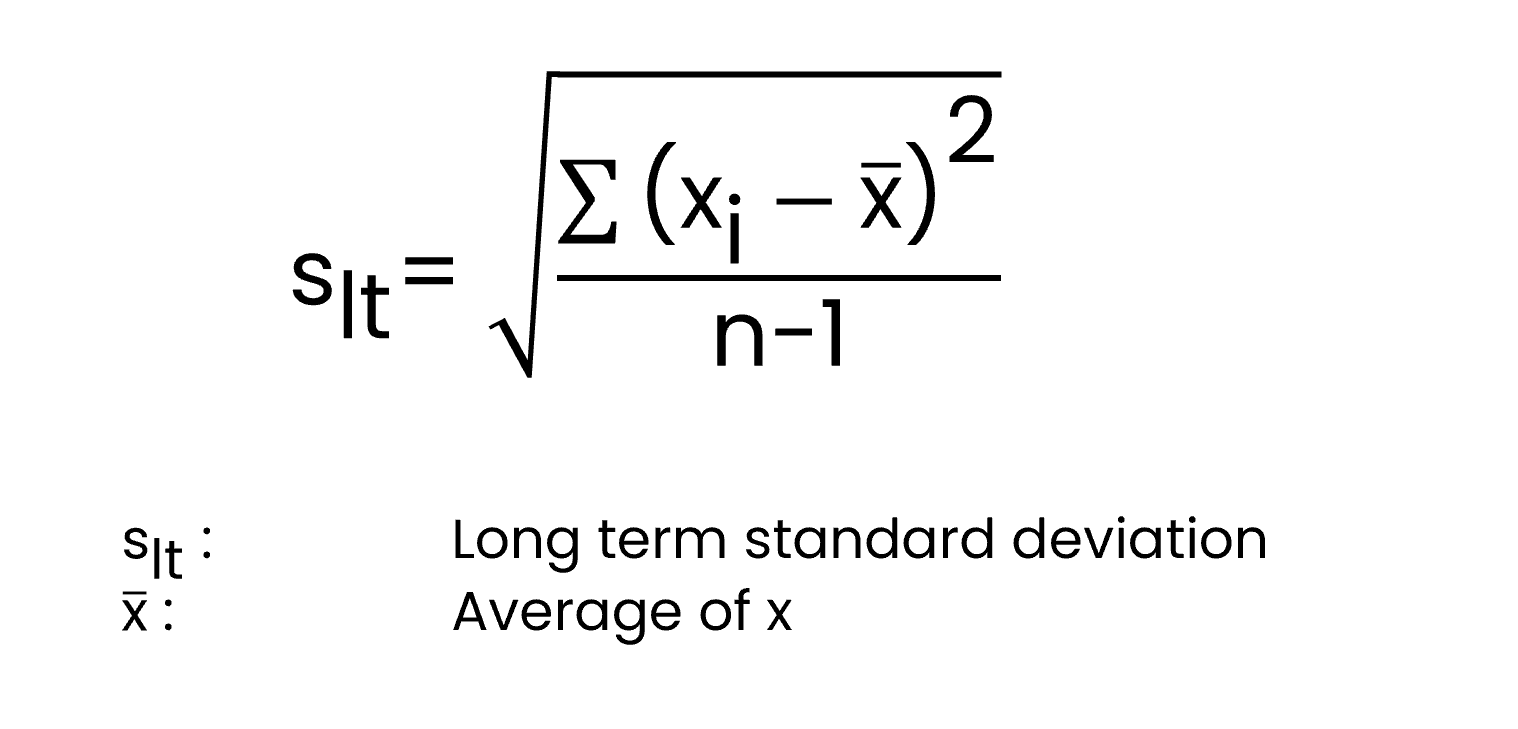
The difference is in the way the standard deviation is calculated: As your statistical software does not know for how long you have been collecting your data it will merely use a trick to calculate both Cpk and Ppk differently from whatever data you have(!)

Minitab uses the regular formula for the long-term standard deviation and estimates the short-term standard deviation from the average moving range (see equation below). Thus, it calculates both metrics from the same set of data!


WHAT EXACTLY IS CPK?

Do you need an explanation on what Cpk is?
Click here to learn more about Cpk.

WHAT EXACTLY IS PPK?

Do you need an explanation on what Ppk is?
Click here to learn more about Ppk.

PRACTICAL CONSEQUENCES


In real life this means that for a given process, the Cpk will most likely show a better value (higher index) than the Ppk.
The very same process may show a Cpk of 1.0 and a Ppk of just 0.8 .This means on a short-term perspective (one batch to the next) your process’ capability is quite ok but for the long run you take into consideration that there are also long-term sources of variation making your process shift over time.  


Hint: if you manage to eliminate all causes for long-term variation, your process can only get as good as your current Cpk shows. To improve beyond your current Cpk, you also need to work on your short-term sources of variation, e.g. on the factors influencing your results from batch to batch.


Join our next Green Belt Training to get certified in systematic process improvement.

Join the open green belt