Ishikawa / Fishbone diagram


O'PEEP EXPLAINS ISHIKAWA 

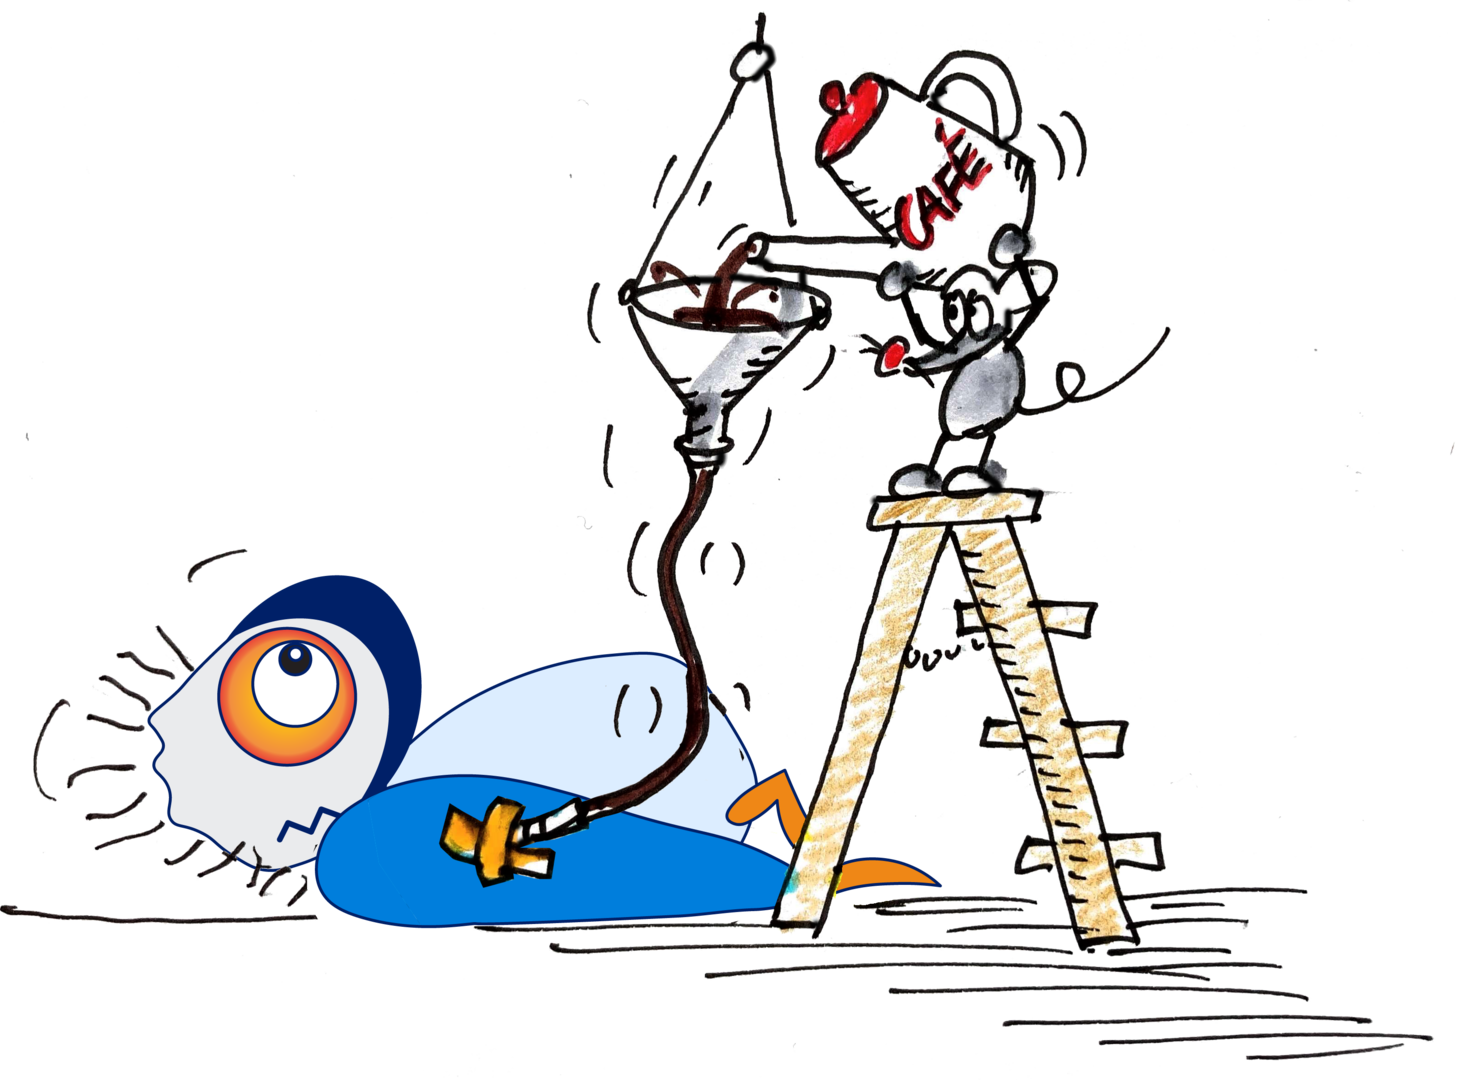
The coffee in the office tastes awful again! O'Peep is desperate. What can he do to improve the coffee quality? Since he is familiar with systematic problem solving, he first wants to determine as many causes as possible for the bad coffee. Ishikawa is the drug of choice!

look inside elearning  


An Ishikawa Diagram / Fishbone diagram / Cause-and-effect diagram helps to identify potential root causes.

WHAT IS AN ISHIKAWA DIAGRAM

An Ishikawa diagram is used to identify and visualize potential causes of a problem. The approach triggers a structured brainstorming that inspires for as many potential root causes as possible.​

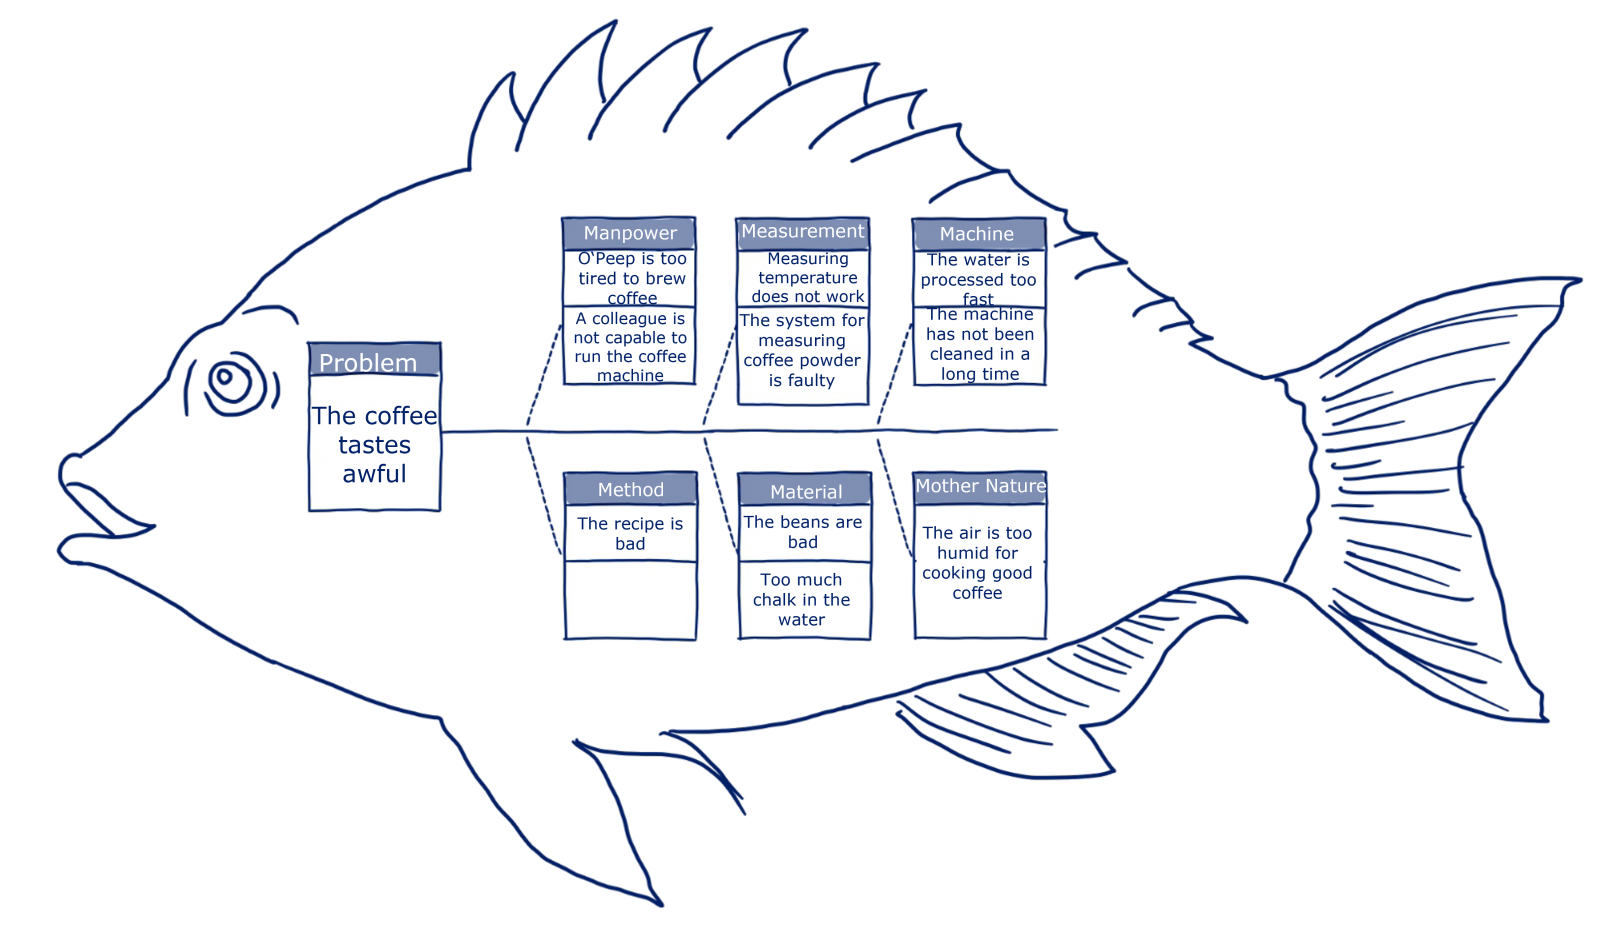
The description of the problem is in the fish head. Possible causes are listed on bones and sub-bones:

  • Machine
  • Material
  • Method
  • Measurement
  • Mother Nature (Environment)
  • Manpower (Personel)

HOW TO GENERATE AN ISHIKAWA DIAGRAM​

  • Organize a team meeting  ​
  • Make sure to have an appropriate problem statement as fishhead​
  • Label the fish bones with categories​
  • Start high level, then brainstorm to a deeper, more detailed level​
  • Collect all potential causes – no bias​
  • Prioritize root causes for investigation in a next step​
  • Evaluate, scope, reflect how to confirm root causes​


​PRACTITIONERS TIP: Do not waste time on discussing which bone to choose for which root cause.  The idea of Ishikawa is to find as many potential root causes as possible.​


Want to learn more about root cause analysis? Look inside our course on systematic problem solving.

look inside elearning